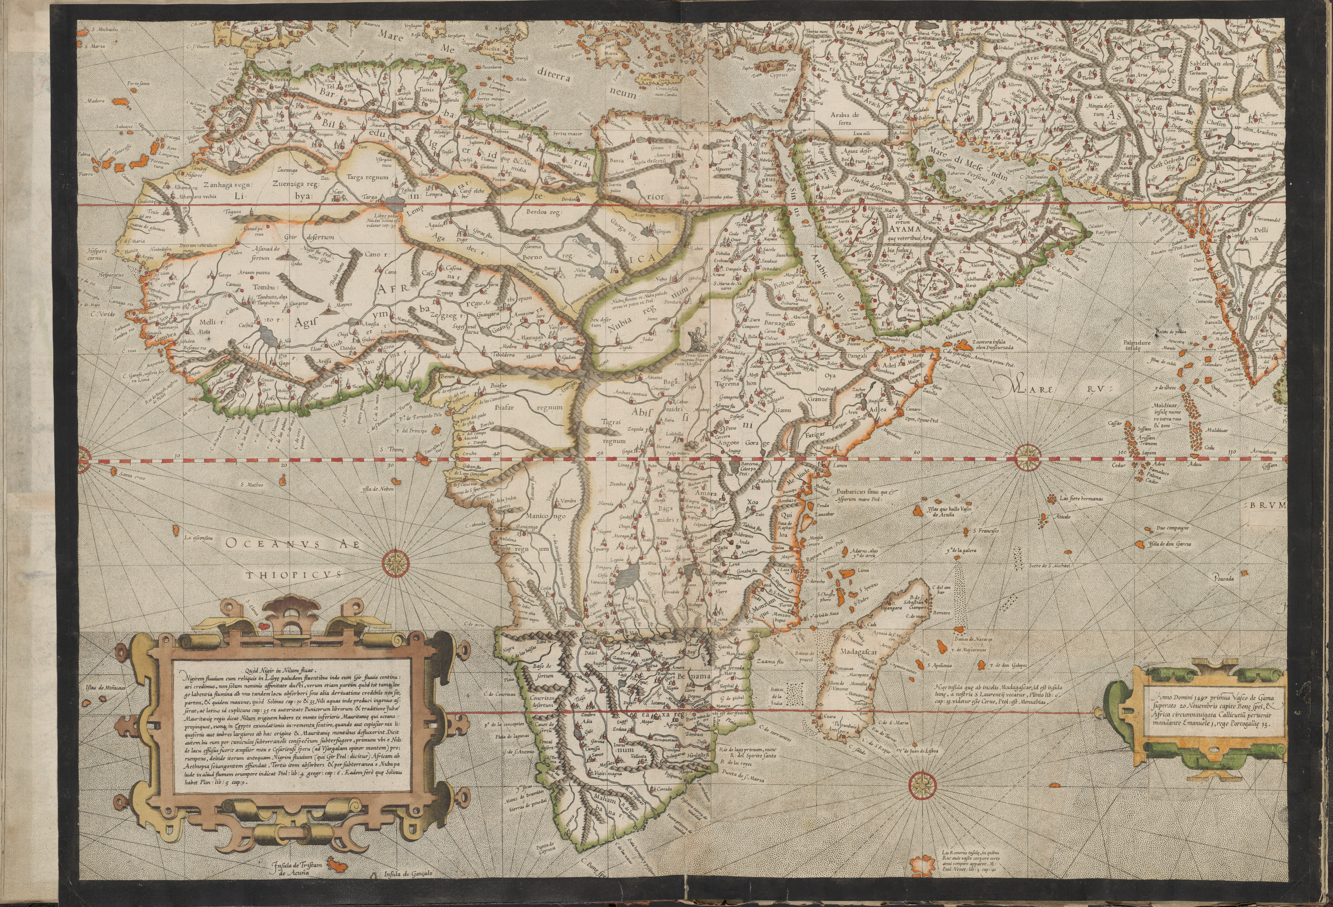
Every map lies
In the pop-up exhibition 'Every Map Lies', discover in four display cases in the library how world maps have been made throughout the centuries and why they always distort the world in some way. Why has the Mercator projection been one of the most widely used map projections for navigation, both on land and at sea, for centuries? Through historical maps, globes and different map projections, you will discover that a map does more than simply represent the world: it also offers a particular way of looking at it.
Practical information
Where to see it
The exhibition 'Every Map Lies' is on display in the library. Admission to the library is free.
When
17 November 2026 to 28 February 2027.
Plan your visitMapmakers have spent centuries finding ways to represent the round Earth on a flat surface. Gerard Mercator experimented with different projections before developing his famous map projection in 1569. An interesting precursor was his double heart-shaped world map from 1538, based on the work of Oronce Fine.
The world map by Willem Jansz. Blaeu, dating from around 1618, is also particularly special. It uses the Mercator projection, and only six copies of this edition are known to exist worldwide. The projection made navigation at sea easier, but distorts the size of landmasses. Greenland, for example, appears almost as large as Africa, even though Africa is fourteen times larger in reality.
Over the centuries, other ways of depicting the world have also been developed. Some maps place the North Pole at the centre, while other projections put the oceans centre stage. They show that every map offers its own perspective on the world.
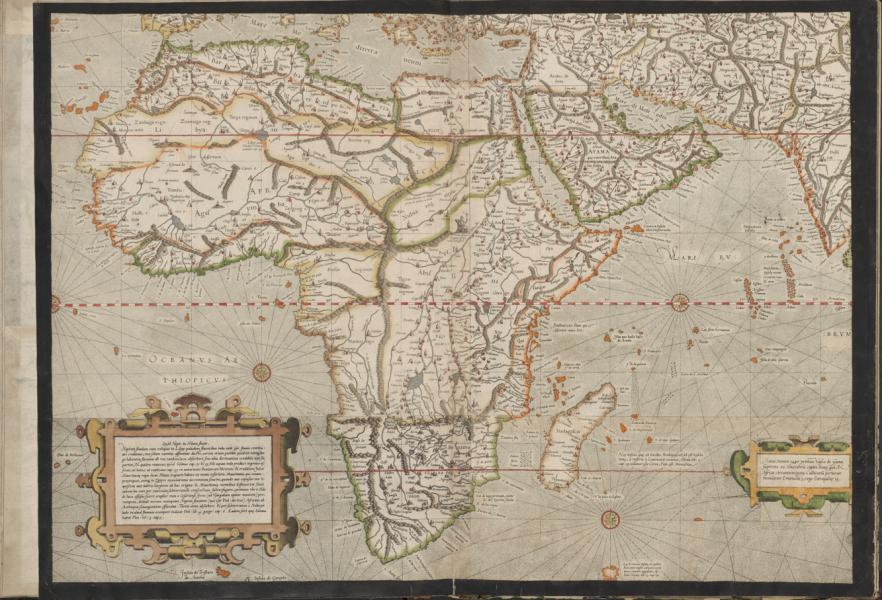 Detail of the 1569 world map by Gerard Mercator.
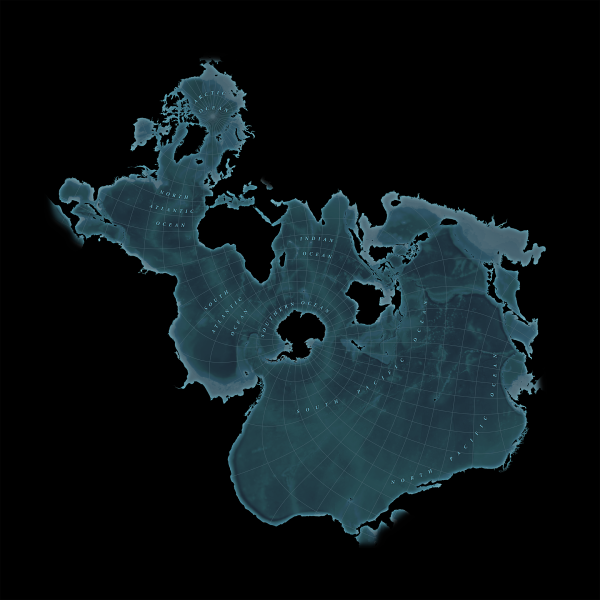 Spilhaus stereographic map projection
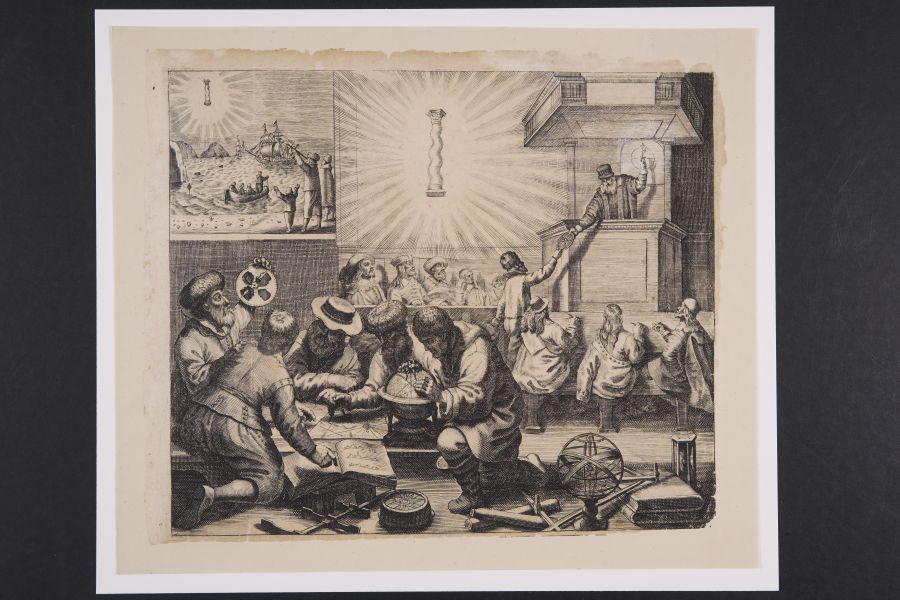 Nautical lesson depicting the study of globes and maps, Jacob Colom, 1648.
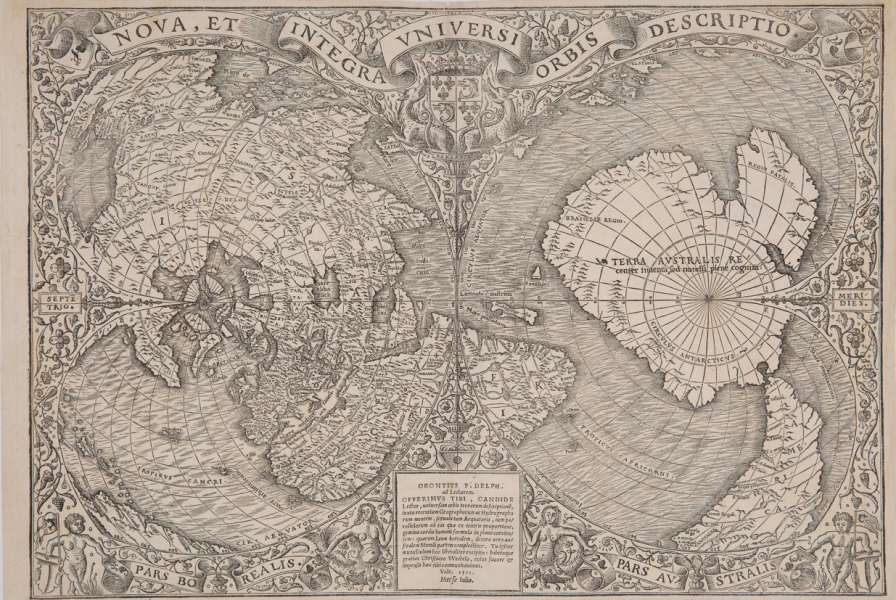 Nova, et integra universi orbis descriptio, Oronce Fine, c. 1531-1532